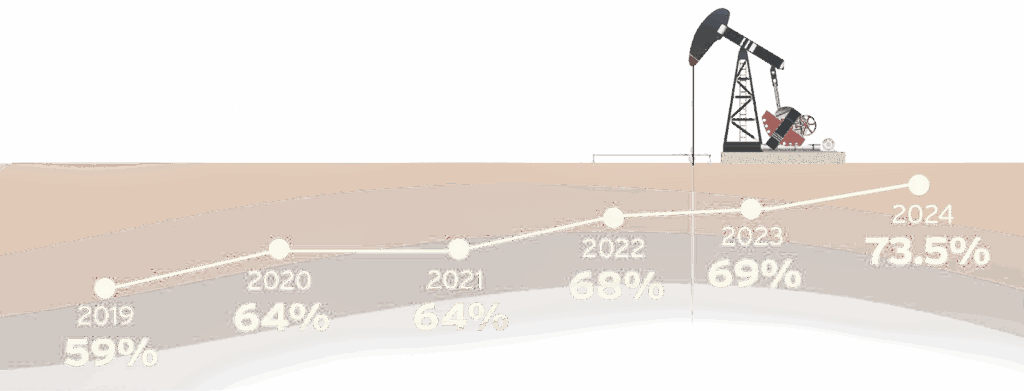
In 2024, the Permian Basin accounted for 73.5% of all severance tax dollars generated, as well as 76% of oil production and 50.6” of gas production in the state of Texas. In addition, 12 counties of the TXDOT-Odessa District account for 53.4% of all severance in the State of Texas, as well as 55.4% of oil production and 32% of gas production. From January to mid-July of 2025, the Permian Basin accounted for 65% of new permits in Texas with 44% of new permits in the TXDOT-Odessa District.
If you want to know where America’s oil boom is happening, no need to look at the whole map—because it’s limited to just ten counties in the Permian Basin. Between 2020 and 2024, these small dots in Texas and New Mexico delivered 93% of all U.S. crude oil growth, according to the latest EIA and Enverus data. It’s almost like the rest of the US doesn’t even matter when it comes to oil production growth. The U.S. added 1.9 million barrels per day (bpd) of new crude and condensate output over that stretch. But nearly all of it came from Lea and Eddy counties in New Mexico, plus Martin and Midland on the Texas side. Lea and Eddy alone punched out almost 1 million bpd of growth. Martin and Midland chipped in another 400,000 bpd, while six more Texas counties—Andrews, Glasscock, Howard, Loving, Reagan, and Ward—added 360,000 bpd combined. Everywhere else in the United States, from Alaska to o shore Gulf of Mexico, growth barely reached 130,000 bpd.
The carbon dioxide (CO2) content in the region is 22.8% lower than the average of the remainder of world production. Permian oil has a 57.6% advantage over Middle Eastern oil and is 74.4% below the CO2 content of tight sand formations. It is also substantially cleaner than the Mayan oil from Mexico and the production from Nigeria.
2050 PROJECTED GDP AND JOBS SUPPORTED BY THE PERMIAN BASIN
Current equipment and technologies for oil and gas development and production from shale formations in the Permian Basin require very large numbers of heavy truckloads. Most of the existing roadway and bridge structures in West Texas were not designed to accommodate the large frequency and weight of these truckloads.
Due to axle load force multipliers developed by AASHTO (The American Association of State Highway and Transportation Officials), the total pavement impact due to a loaded truck weighing 80,000 lbs. is 18,009 times greater than the impact of a single passenger vehicle weighing 4,000 lbs.
The pavement impact per loaded truck on county roads
is even higher than that of state highway and secondary state roads with a single 80,000 lb. loaded truck equal to the impact of 1.2 million passenger vehicles.
Current horizontal well development estimates in the Permian Basin show that 4,000 fully loaded trucks are needed to complete a well, meaning that a single well would be the rough equivalent of more than 72 million passenger vehicles.
The accelerated damage of pavement structure due to energy-related trucking along secondary state highways and local roads are estimated between $1.5-$2 billion per year, with the majority of that activity occurring in the Permian Basin.
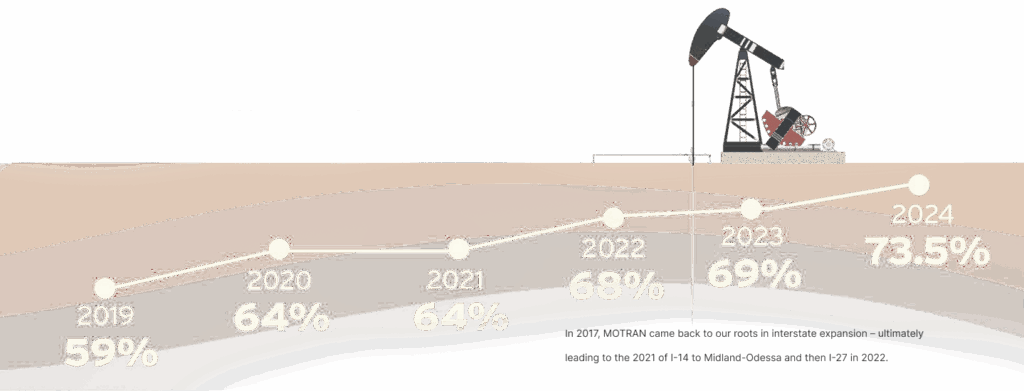
In 2017, MOTRAN came back to our roots in interstate expansion – ultimately leading to the 2021 of I-14 to Midland-Odessa and then I-27 in 2022.